Why are 80% of equipment failures not related to his age?


According to statistics, more than 80% of failures are not related to the age of the equipment.
Let’s figure it out together, and where this figure came from.
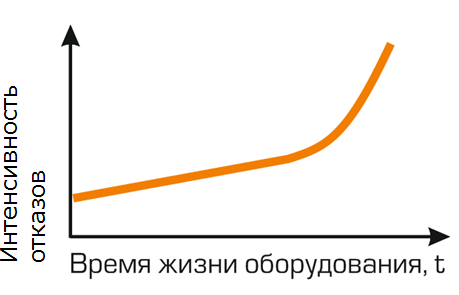
Initially, it was believed that the failure rate of equipment increases over time, and it looks like this:
The curve in this graph, which shows the change in the failure rate over time, is called the failure pattern.
Such a failure pattern, as in the above figure, is typical for simple parts and devices, the failure of which is caused primarily by wear.
This gives rise to the idea of carrying out repairs with a given frequency (scheduled preventive repairs according to calendar time), the frequency of such repairs is determined by the time of the onset of the aging period.
However, modern technology consists not only of simple units and assemblies, and more and more high requirements are beginning to be imposed on its reliability.
After the end of World War II, the world began a rapid growth of industry, accompanied by the mechanization of production. Enterprises are starting to depend very much on equipment.
Aviation also developed.
In the 1950s and 1960s, overhauls of a typical aircraft engine took place every 8000 hours. A growing number of failures was noticed towards the end of this overhaul period. Therefore, it was concluded that maintenance and repair should be carried out at a shorter interval of time, preventing aging of the engines, and as a result, its failure. The time between repairs was reduced.
Easy, right?
But the increase in the number of preventive measures had three very unexpected results. The results that ultimately turned the service world upside down.
First of all, the occurrence of certain types of failures has indeed decreased. This was exactly what everyone expected. Things are good.
The second result was that a large number of failures occurred as often as before. This was not expected and confused the researchers a bit.
The third result was that most failures began to occur more often. In other words, an increase in maintenance and repair activities has led to an increase in the number of failures. It was illogical, and it was a shock to the system.
Extensive studies of the failure mechanisms were carried out, which led to unexpected conclusions – in 1968 at the United Airlines (UAL), then in 1973 at Sweden (Bromberg), and then in 1982 at the U.S. Navy. It turned out that only from 8% to 23% of failures corresponds to the idea that the failure rate grows with the time between equipment. These failures are inherent in relatively simple objects.
As for technically complex objects, it turned out that there is no or almost no relationship between the probability of their failure and the useful life. And this is from 77% to 92% of failures. For these objects, the failure rate, at least outside the running-in interval, has a constant value that does not change with the mean time.
Failure Patterns
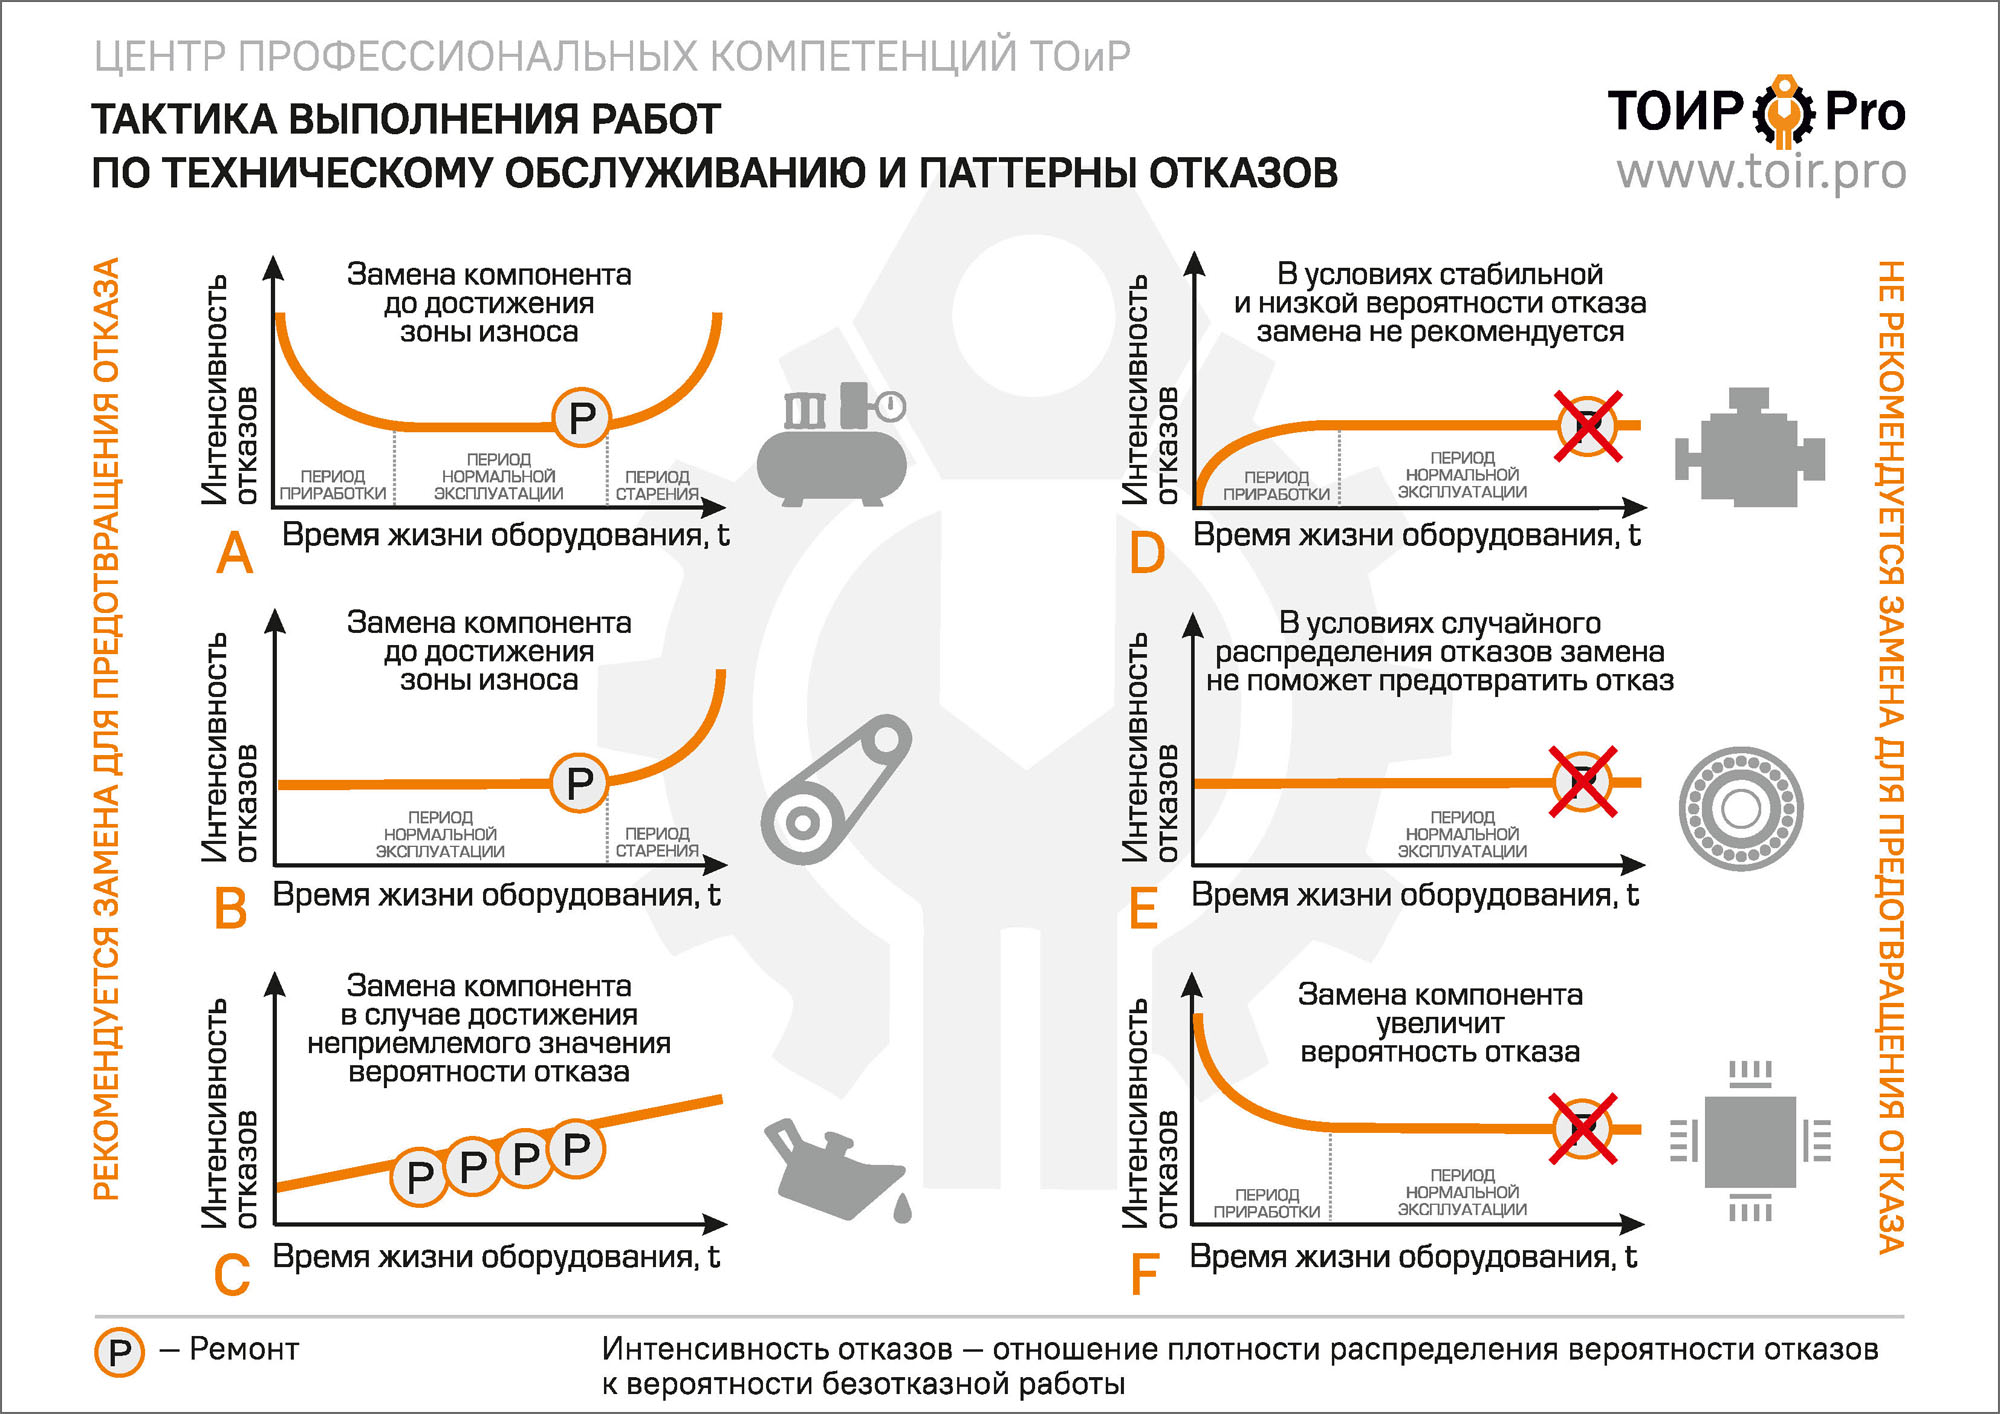
A group of researchers identified six models describing the relationship between the age of the equipment and the number of failures.
What are the revealed dependencies talking about? How can we use knowledge about the failure rate of our equipment at different points in time to determine the tactics of its maintenance?
We will analyze in more detail all six failure patterns and identify their practical benefits for us.
Other MRO Posters
A
This is the most famous diagram called the U-shaped failure rate curve. Three main zones are distinguished from left to right.
The first is a break-in period with a high probability of failure. The curve goes down until it becomes stable. This failure is called failure during the initial period of operation and means that each new installed component is initially at high risk of failure (“Child Mortality Syndrome”).
The second zone is the period of normal operation with a stably low probability of failure.
The third zone is the equipment wear zone. Based on the information on the graph, it can be concluded that replacing a component before reaching the wear zone will reduce the likelihood of failure. However, it must be borne in mind that despite everything, there remains a high risk of equipment failure during the running-in period.
B
This graph is similar to Option A, but it does not have a failure zone in the run-in period. Sometimes the absence of such a zone is a characteristic of equipment, the manufacturer of which previously excluded components with defects that arise at the initial stage of operation. Such a process is known as a failure test.
As in Schedule A, replacing a component to the wear zone is the best way to reduce the likelihood of failure, and in this case, the possibility of a potential failure in the run-in period is not taken into account.
C
Figure C shows that the conditional probability of failure increases in direct proportion to the life of the equipment.
It is not possible to identify a specific wear zone here, therefore there is no optimal term for replacing a component. Theoretically, a replacement can be made when the probability of failure reaches a certain value that is not acceptable in each particular situation.
D
On graph D there is a low probability of failure at the beginning of the equipment life cycle, which subsequently increases to an acceptable level and remains constant for the further life. It is worth noting that this zone with a conditionally stable probability of failure proves to us that often failures occur by chance.
In this case, replacing the component will not bring any benefit, excluding the period of low probability of failure at the beginning of operation, which is actually insignificant in comparison with the rest of the service life of the equipment.
E
This figure shows a stable probability of failure over the life of the equipment. In RCM, such a schedule is called a random distribution of failures.
Here, replacing a component will not help reduce the likelihood of a failure.
F
Shows random malfunctions, the probability of which is high in the run-in period, but decreases over time.
In this case, the replacement of the component will not only bring no benefit, but will also increase the likelihood of failure, because initially the equipment went into operation with a high probability of failure at the running-in stage.
It follows from the above that for 70% of equipment that has a constant probability of failure, it makes no sense to perform time-based tasks to extend the life of the device, such as maintenance or replacement.
It makes no sense to spend resources on servicing or replacing an assembly or component whose reliability has not decreased, or whose reliability cannot be improved by this maintenance task.
In practice, this means that 70% – 90% of the equipment will benefit from some form of condition monitoring. And only 10% – 30% can be effectively managed by replacement or overhaul over time.
Источник: https://toir.pro/mod/book/view.php?id=71&chapterid=309